# Recognizing Double Tops and Bottoms
The patterns of double tops and double bottoms are widely admired for their simplicity and effectiveness in the realm of technical analysis. These patterns serve as harbingers of potential reversals in the market, providing traders with critical insights for making informed decisions. This article delves into the nuances of identifying these patterns and the strategies to capitalize on them.
##
Understanding Double Tops and Bottoms
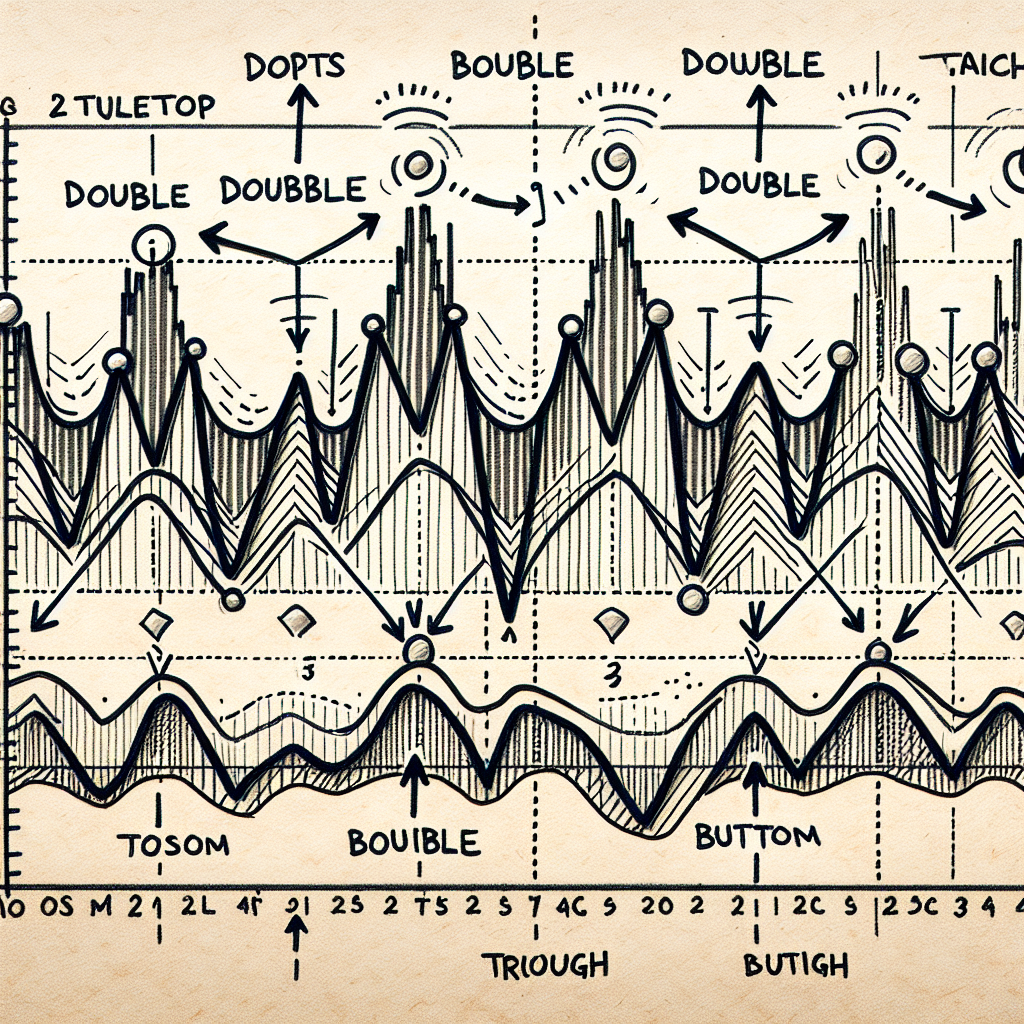
Double tops and double bottoms are revered technical analysis patterns that signify potential reversals in the ongoing trend. A double top is characterized by two consecutive peaks at approximately the same level, indicating a possible bearish reversal after an uptrend. Conversely, a double bottom features two consecutive troughs, suggesting a bullish reversal following a downtrend.
##
Identifying Double Tops
Recognizing a double top pattern is pivotal for traders aiming to anticipate a bearish reversal. Here’s how to spot one:
###
Step 1: Prior Uptrend
The formation of a double top begins during an existing uptrend, making it essential to identify a significant rise in price before the pattern develops.
###
Step 2: The First Peak
The initial peak marks the highest point reached during the uptrend, after which the price undergoes a minor reversal or pullback.
###
Step 3: Pullback
Following the first peak, the price retraces downwards but finds support, preventing a substantial decline.
###
Step 4: The Second Peak
The price ascends again, creating a second peak nearly equivalent to the first. This near-identical high signals the potential exhaustion of the uptrend.
###
Step 5: Confirmation
The pattern is confirmed when the price falls below the support level established during the pullback. This breakdown indicates a trend reversal, signaling traders to consider taking short positions.
##
Identifying Double Bottoms
A double bottom pattern, indicating a possible shift from a downtrend to an uptrend, can be spotted through these steps:
###
Step 1: Prior Downtrend
Look for an existing downtrend before the formation of a double bottom, as this pattern emerges at the trough of market movement.
###
Step 2: The First Trough
The initial trough represents the lowest point reached during the downtrend, followed by a mild price rebound.
###
Step 3: Rebound
After the rebound, the price faces resistance, causing it to turn downwards once again.
###
Step 4: The Second Trough
The price declines to form a second trough, almost parallel to the first, indicating the downtrend’s potential fatigue.
###
Step 5: Confirmation
Confirmation of the double bottom pattern occurs when the price breaks through the resistance level encountered during the rebound. This breakthrough is a bullish signal, suggesting it might be an opportune time to consider long positions.
##
Trading Strategies
Upon recognizing a double top or bottom, traders can employ various strategies to navigate their positions:
– **For Double Tops**: It’s advisable to enter a short position once the price breaks below the support level, setting a stop-loss slightly above the recent peak.
– **For Double Bottoms**: Conversely, entering a long position when the price breaks above the resistance level, with a stop-loss placed just below the recent trough, can maximize upside potential.
##
Conclusion
The ability to identify double tops and bottoms provides traders with a strategic edge in predicting market reversals. By meticulously following the steps outlined above and employing prudent trading strategies, investors can enhance their chances of navigating the complexities of the market with greater confidence and success.

