

Introduction to Common Chart Patterns
In the realm of financial markets, chart patterns play an integral role in technical analysis, helping traders and analysts to predict future market movements by studying historical price action. Recognizing and understanding these patterns can significantly enhance one’s trading strategy by providing insights into the market sentiment and potential price movements. This article aims to demystify some of the most common chart patterns, shedding light on how to identify and interpret them for better trading decisions.
Types of Chart Patterns
Chart patterns are broadly categorized into two main types: continuation patterns, which signal the continuation of an existing trend, and reversal patterns, which indicate the possibility of a trend reversal. We’ll explore examples of both to equip you with the knowledge to identify these patterns in the wild.
Continuation Patterns
Continuation patterns suggest that the market will maintain its current trajectory following a brief pause. Some of the most notable continuation patterns include:
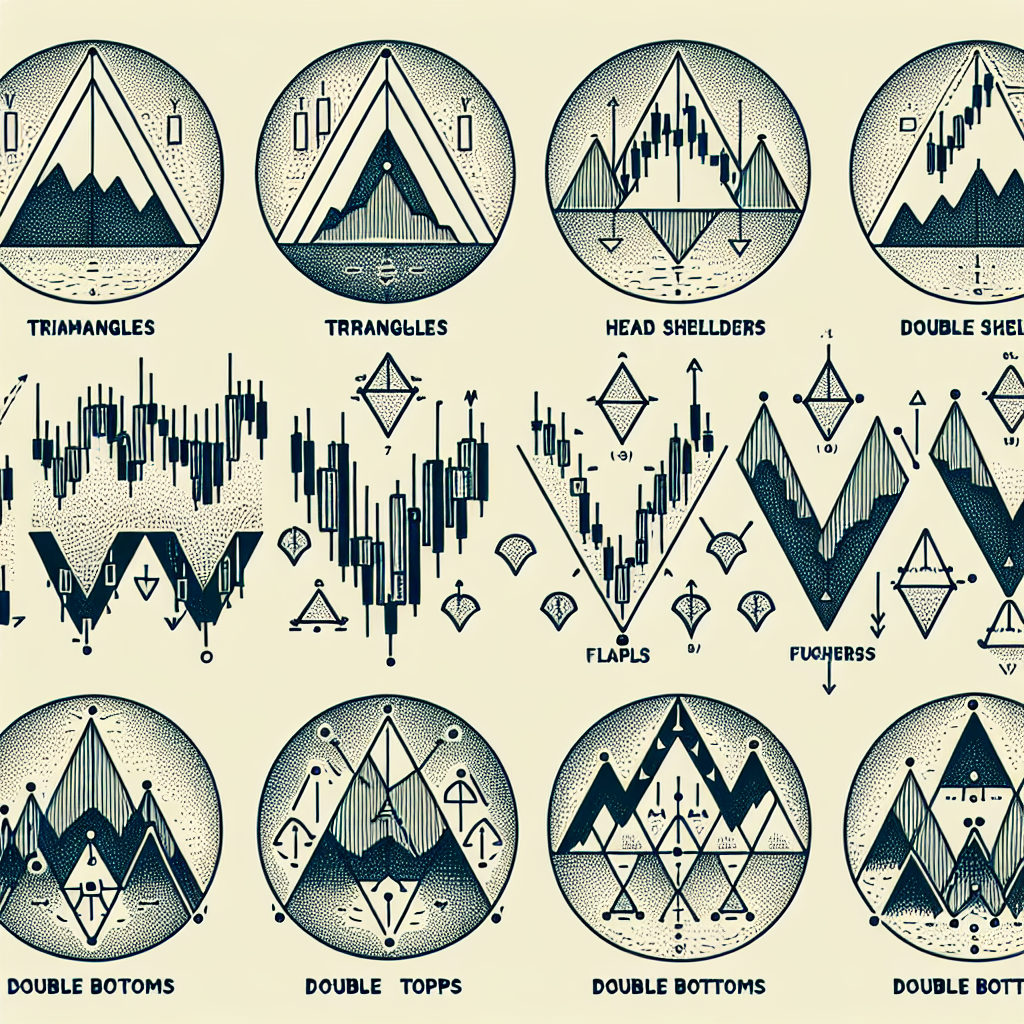
– Triangles: Triangles are formed when the price action begins to tighten, creating a converge point. They can be ascending, descending, or symmetrical.
– Flags and Pennants: These patterns are characterized by a sharp price movement followed by a generally smaller rectangular (flag) or triangular (pennant) consolidation, before continuing in the direction of the initial movement.
Reversal Patterns
Reversal patterns, on the other hand, suggest that the current trend is about to change direction. Key reversal patterns to look out for include:
– Head and Shoulders: This pattern is composed of three peaks, with the middle peak (the head) being the highest and the other two (shoulders) being lower but approximately equal in height. A Head and Shoulders pattern signals a potential reversal from bullish to bearish.
– Double Top and Double Bottom: These patterns resemble the letter “M” (double top) or “W” (double bottom) and signal a potential reversal from bullish to bearish (in case of a double top) or bearish to bullish (in case of a double bottom).
Identifying Chart Patterns
Spotting chart patterns requires a keen eye and practice. Here are some tips to help you identify these patterns more effectively:
Understand the Context
It’s crucial to take into account the broader market context when identifying chart patterns. Some patterns are more reliable when they form after a significant trend or in a specific market phase.
Look for Confirmation
Always seek confirmation before acting on a pattern. For example, a breakout on significant volume following a pattern completion can serve as a confirmation of the pattern’s validity.
Pay Attention to Volume
Volume is a vital indicator when it comes to confirming chart patterns. Patterns accompanied by high volume during the breakout or breakdown are generally considered more reliable.
Common Mistakes to Avoid
While chart patterns can be powerful tools, false signals and misinterpretations are common pitfalls. Some mistakes to avoid include:
– Ignoring volume as a confirmation signal.
– Acting on incomplete patterns without waiting for them to fully form.
– Failing to consider the larger market context or trend.
Conclusion
Mastering the art of identifying and interpreting chart patterns can significantly enhance your market analysis and decision-making process. While it requires practice and patience, the ability to spot these patterns can be a valuable addition to any trader’s toolkit. Remember to always complement pattern analysis with other forms of technical and fundamental analysis for the best results.