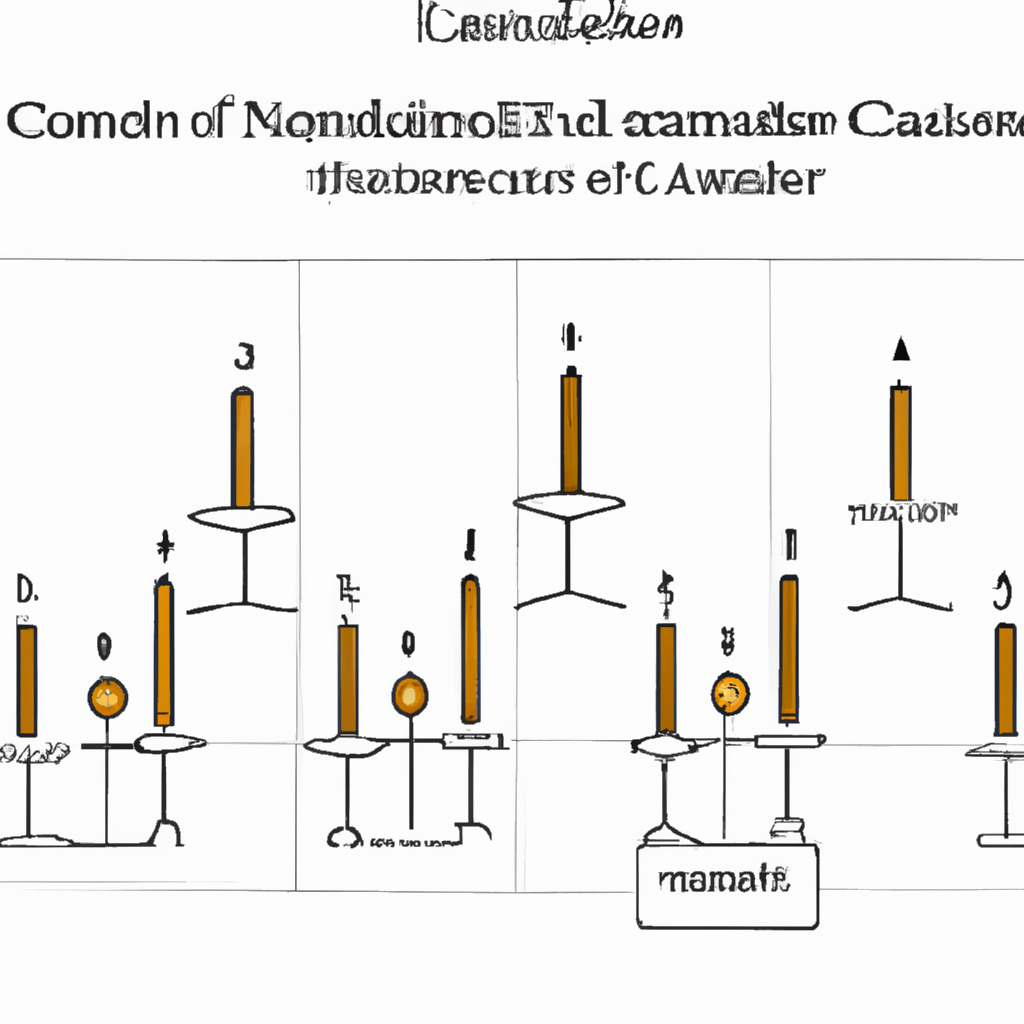
Candlestick Patterns Explained
When it comes to technical analysis in financial markets, candlestick patterns play a crucial role in understanding price movements and making informed trading decisions. Candlestick charts provide a visual representation of price action, making it easier for traders to identify trends, reversals, and potential entry or exit points. In this article, we will explore some commonly used candlestick patterns and their significance.
1. Doji
A Doji candlestick pattern is characterized by a small body with upper and lower shadows of equal length. This pattern suggests indecision in the market, often occurring at the end of a trend or during periods of consolidation. Traders interpret a Doji as a potential reversal signal, indicating that the balance between buyers and sellers is shifting.
2. Hammer and Hanging Man
The Hammer and Hanging Man patterns are similar in appearance, with a small body and a long lower shadow. The difference lies in their position within the trend. A Hammer appears at the end of a downtrend, indicating a potential reversal to the upside. On the other hand, a Hanging Man occurs at the end of an uptrend, signaling a possible bearish reversal. These patterns suggest that buyers are stepping in to support the price, but confirmation is required before taking action.
3. Engulfing Patterns
Engulfing patterns consist of two candles, where the body of the second candle completely engulfs the body of the previous candle. A bullish engulfing pattern occurs when a small bearish candle is followed by a larger bullish candle, indicating a potential reversal to the upside. Conversely, a bearish engulfing pattern suggests a reversal to the downside. These patterns are considered strong signals, especially when they appear at key support or resistance levels.
4. Morning and Evening Stars
Morning and Evening Star patterns are three-candle formations that indicate potential reversals. The Morning Star pattern appears after a downtrend and consists of a long bearish candle, followed by a small-bodied candle that gaps lower, and finally a long bullish candle. This pattern suggests that the bears are losing control, and the bulls may take over. The Evening Star pattern is the opposite, appearing after an uptrend and signaling a potential shift towards bearish sentiment.
5. Shooting Star and Inverted Hammer
The Shooting Star and Inverted Hammer patterns are characterized by a small body and a long upper shadow. The Shooting Star appears at the end of an uptrend, indicating a potential reversal to the downside. Conversely, the Inverted Hammer occurs at the end of a downtrend, suggesting a possible bullish reversal. These patterns reflect a struggle between buyers and sellers, with the shadow representing the rejection of higher or lower prices.
Conclusion
Candlestick patterns provide valuable insights into market sentiment and can assist traders in making informed decisions. However, it is important to note that candlestick patterns should not be used in isolation but rather in conjunction with other technical indicators and analysis techniques. By understanding and recognizing these patterns, traders can enhance their ability to identify potential trading opportunities and manage risk effectively.

