Elliott Wave Analysis Methods
Introduction
Elliott Wave analysis is a popular technical analysis method used by traders and investors to predict future price movements in financial markets. Developed by Ralph Nelson Elliott in the 1930s, this approach is based on the principle that market prices move in repetitive patterns, which can be identified and analyzed to make informed trading decisions. In this article, we will explore the key methods used in Elliott Wave analysis.
1. Wave Identification
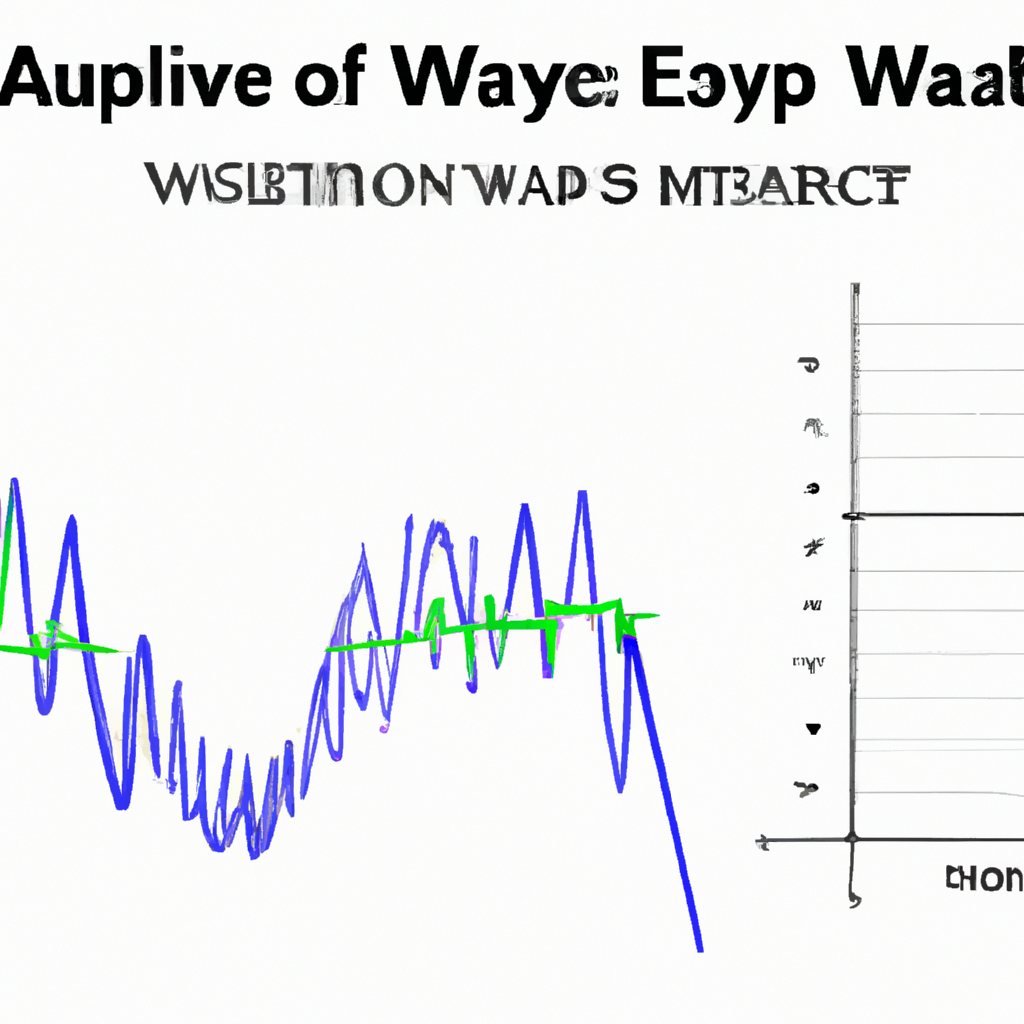
The first step in Elliott Wave analysis is to identify the waves within a price chart. According to Elliott, market prices move in a series of five waves in the direction of the main trend, followed by three corrective waves. These waves are labeled with numbers and letters, where impulse waves (in the direction of the trend) are numbered 1, 2, 3, 4, and 5, and corrective waves are labeled A, B, and C. Traders use various techniques and indicators to identify these waves accurately.
2. Fibonacci Ratios
Fibonacci ratios play a crucial role in Elliott Wave analysis. Traders use these ratios to determine potential price targets and retracement levels within the wave structure. The most commonly used Fibonacci ratios are 0.382, 0.500, and 0.618, which are derived from the Fibonacci sequence. These levels help traders identify areas of support and resistance, aiding in making trading decisions.
3. Wave Extensions
Elliott Wave analysis also considers wave extensions, which occur when one of the impulse waves extends beyond the typical length. Extensions often indicate strong momentum and can provide valuable insights into the potential magnitude of a price move. Traders use Fibonacci extensions to project price targets for these extended waves, helping them identify potential profit-taking levels.
4. Wave Relationships
Another important aspect of Elliott Wave analysis is understanding the relationships between different waves. For example, Wave 3 is often the longest and strongest wave within a trend, while Wave 2 typically retraces a significant portion of Wave 1. By studying these relationships, traders can gain insights into the overall market structure and anticipate future price movements.
5. Wave Validation
To increase the reliability of Elliott Wave analysis, traders often use additional technical indicators and tools to validate their wave counts. This can include trend lines, moving averages, oscillators, and volume analysis. By confirming the wave structure with other indicators, traders can reduce the chances of false signals and improve the accuracy of their analysis.
Conclusion
Elliott Wave analysis is a powerful tool for traders and investors to understand market trends and make informed trading decisions. By identifying and analyzing the repetitive wave patterns within price charts, traders can anticipate potential price movements and identify areas of support and resistance. However, it is important to note that Elliott Wave analysis is subjective and requires practice and experience to master. Traders should always use proper risk management techniques and combine Elliott Wave analysis with other tools and indicators for a comprehensive trading strategy.

