

Introduction to Ichimoku Cloud
The Ichimoku Kinko Hyo or Ichimoku Cloud is a comprehensive indicator that defines support and resistance, identifies trend direction, gauges momentum, and provides trading signals. Developed by Goichi Hosoda in the late 1930s, it has become a beloved tool among traders for its ability to offer a quick understanding of the market sentiment at a glance. The ‘cloud’ is a central feature of this indicator, designed to highlight future potential price action.
The Components of Ichimoku Cloud
The Ichimoku Cloud comprises five main components, each serving a unique purpose in market analysis:
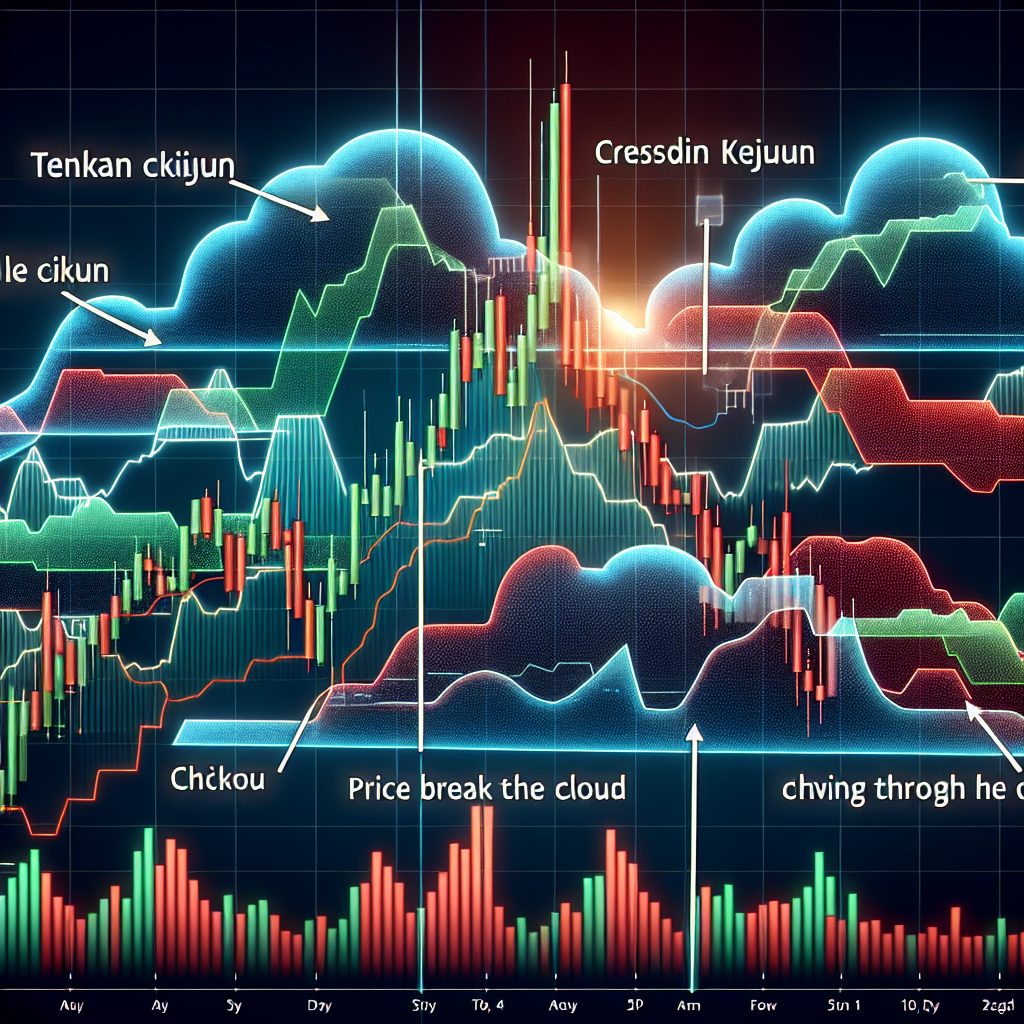
Tenkan-sen (Conversion Line)
This is calculated as the average of the highest high and the lowest low over the last nine periods. It is typically marked by a red line on charts and helps in identifying the market trend. A rising Tenkan-sen indicates upward momentum.
Kijun-sen (Base Line)
Calculated over the last 26 periods, the Kijun-sen averages the highest high and the lowest low. This line, usually blue, acts as an indicator of market movement, with prices above it signaling a bullish trend and vice versa.
Senkou Span A (Leading Span A)
Senkou Span A is one of the two lines bounding the ‘cloud’, calculated as the average of the Tenkan-sen and the Kijun-sen, plotted 26 periods ahead. Its position relative to Senkou Span B signals market strength.
Senkou Span B (Leading Span B)
Formed by averaging the highest high and the lowest low over 52 periods, plotted 26 periods into the future, Senkou Span B completes the ‘cloud’. The width of the cloud reflects market volatility.
Chikou Span (Lagging Span)
This component is the closing price plotted 26 periods into the past. A Chikou Span above the price is bullish, while one below indicates bearish sentiment.
Reading Ichimoku Cloud Signals
Understanding how to interpret the signals given by the Ichimoku Cloud can significantly enhance your trading decisions:
Trend Analysis
The trend is considered bullish when the price is above the cloud, bearish when below, and within the cloud suggests a range or consolidation. The relative position of the Tenkan-sen and Kijun-sen can also provide insights into the trend strength and potential reversals.
Momentum and Entry Points
A bullish signal occurs when the Tenkan-sen crosses above the Kijun-sen, known as a “Golden Cross”. Conversely, a “Death Cross” occurs when the Tenkan-sen crosses below the Kijun-sen, indicating a bearish signal. The strength of these signals is further validated by their position relative to the cloud.
Support and Resistance Levels
The cloud itself acts as a dynamic area of support and resistance, with the Senkou Span A and B lines serving as the primary markers. A thick cloud suggests strong support/resistance, while a thin cloud indicates weaker zones that may be easier to break through.
Advantages and Limitations
The Ichimoku Cloud offers a high level of visual information, making complex market analysis simpler. However, like all indicators, it is not foolproof and works best when combined with other tools and in consideration of the overall market context. It can also be lagging, as many of its components are based on historical data.
Conclusion
The Ichimoku Cloud is a versatile and powerful tool for traders who wish to gauge market sentiment, identify potential trends, and spot support and resistance levels. With practice, it can enhance one’s trading strategy by providing clear signals for entering and exiting trades. However, it’s essential to remember that no indicator should be used in isolation, and the Ichimoku Cloud is most effective when used alongside other forms of analysis.