Oscillators and Momentum Indicators: Understanding Their Role in Technical Analysis
Introduction
When it comes to analyzing financial markets, traders and investors often rely on various tools and indicators to make informed decisions. Two popular types of indicators are oscillators and momentum indicators. These technical analysis tools help identify potential price reversals, overbought or oversold conditions, and the strength of price movements. In this article, we will explore what oscillators and momentum indicators are, how they work, and how they can be used in trading strategies.
What are Oscillators?
Oscillators are a type of technical indicator that fluctuates between two extreme levels, typically indicating overbought or oversold conditions in the market. They help traders identify potential turning points in price trends, signaling when a market is due for a reversal. Oscillators are most effective in range-bound markets where prices tend to move between support and resistance levels.
How Do Oscillators Work?
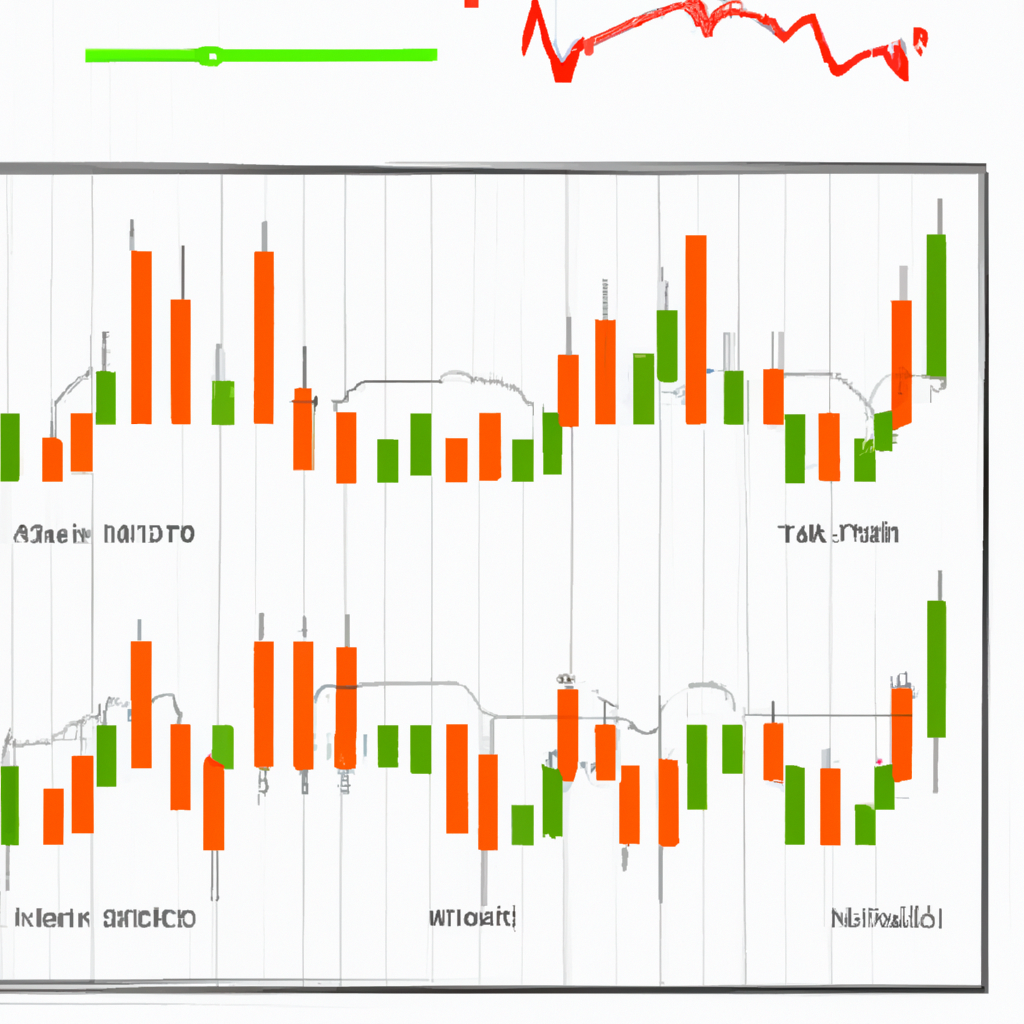
Oscillators are typically plotted as lines on a separate chart below the price chart. They are calculated using various mathematical formulas that analyze historical price data. The resulting values oscillate between predefined levels, usually ranging from 0 to 100. Different oscillators have different interpretation methods, but most commonly, readings above 70 indicate overbought conditions, while readings below 30 indicate oversold conditions.
Popular Oscillators
There are several widely used oscillators in technical analysis. Some of the most popular ones include:
- Relative Strength Index (RSI): Measures the speed and change of price movements, indicating overbought or oversold conditions.
- Stochastic Oscillator: Compares the closing price of an asset to its price range over a certain period, identifying potential turning points.
- MACD (Moving Average Convergence Divergence): Combines moving averages to identify potential trend reversals and generate buy or sell signals.
What are Momentum Indicators?
Momentum indicators, as the name suggests, measure the speed and strength of price movements. They help traders determine whether a trend is gaining or losing momentum, which can be useful in identifying potential trend continuations or reversals. Unlike oscillators, momentum indicators do not have predefined boundaries and can provide valuable insights in both trending and range-bound markets.
How Do Momentum Indicators Work?
Momentum indicators are typically plotted as lines on a separate chart, similar to oscillators. They are calculated using various mathematical formulas that compare the current price to previous prices. The resulting values can be positive or negative, indicating upward or downward momentum, respectively. Traders look for divergences between price and momentum indicators, as well as extreme readings, to identify potential trading opportunities.
Popular Momentum Indicators
There are several widely used momentum indicators that traders rely on. Some of the most popular ones include:
- Moving Average Convergence Divergence (MACD): Measures the relationship between two moving averages, indicating potential trend reversals.
- Relative Strength Index (RSI): Also considered a momentum oscillator, RSI measures the strength and speed of price movements.
- Rate of Change (ROC): Measures the percentage change in price over a specified period, helping identify overbought or oversold conditions.
Using Oscillators and Momentum Indicators in Trading Strategies
Oscillators and momentum indicators can be powerful tools when incorporated into trading strategies. They can help traders identify potential entry and exit points, confirm trends, and manage risk. However, it is important to note that no indicator is foolproof, and they should always be used in conjunction with other technical analysis tools and risk management techniques.
Traders often look for divergences, overbought or oversold conditions, and crossovers between the indicator and price to generate trading signals. Additionally, combining multiple indicators can provide more robust signals and confirmation.
Conclusion
Oscillators and momentum indicators are valuable tools in technical analysis, helping traders make informed decisions based on price movements and market conditions. By understanding how these indicators work and incorporating them into trading strategies, traders can enhance their chances of success in the financial markets. However, it is essential to use these indicators in conjunction with other analysis techniques and risk management strategies to mitigate potential risks.

