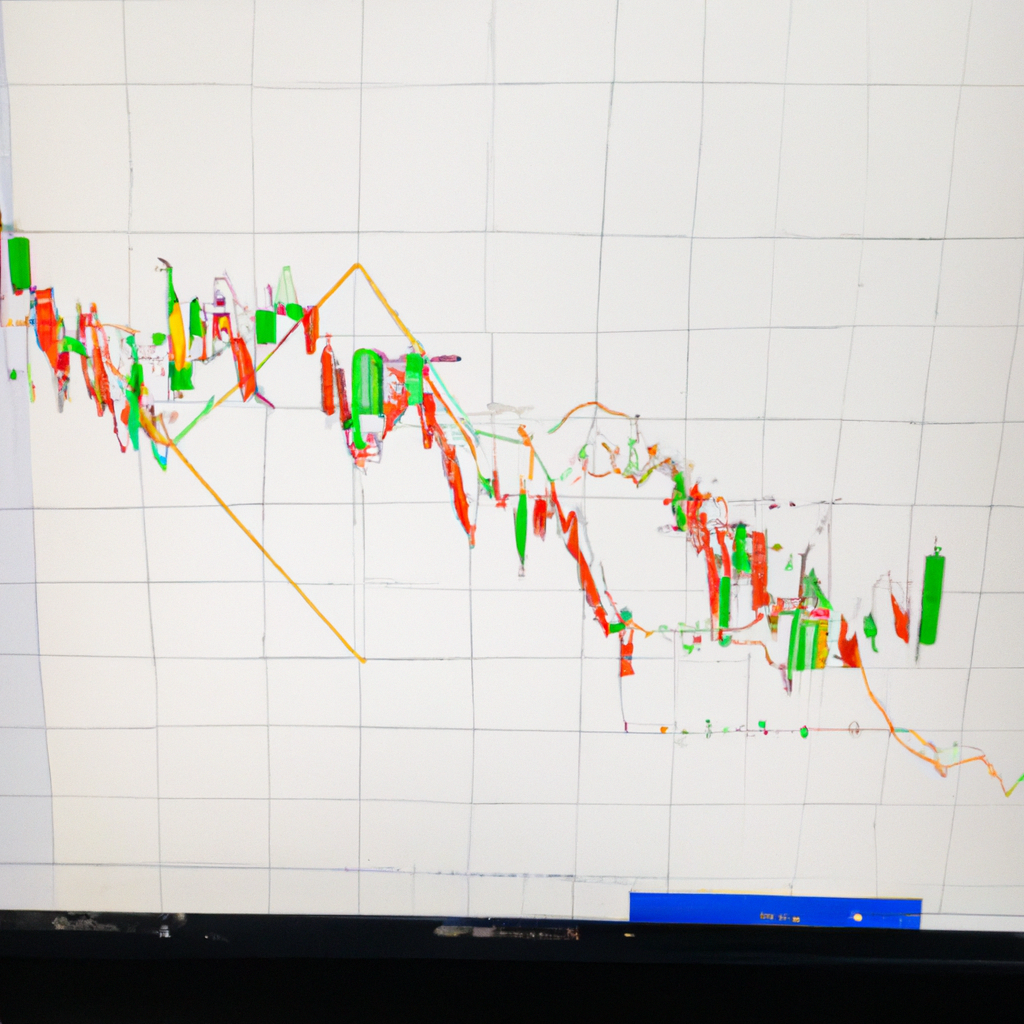
Using MACD for Trade Signals
Introduction
The Moving Average Convergence Divergence (MACD) is a popular technical indicator used by traders to identify potential trade signals. It helps traders determine the direction and strength of a trend, as well as potential entry and exit points. In this article, we will explore how to effectively use MACD for trade signals.
Understanding MACD
The MACD indicator consists of three components: the MACD line, the signal line, and the histogram. The MACD line is calculated by subtracting the 26-day exponential moving average (EMA) from the 12-day EMA. The signal line is a 9-day EMA of the MACD line. The histogram represents the difference between the MACD line and the signal line.
Identifying Trend Reversals
One of the primary uses of MACD is to identify potential trend reversals. When the MACD line crosses above the signal line, it generates a bullish signal, indicating a potential upward trend. Conversely, when the MACD line crosses below the signal line, it generates a bearish signal, indicating a potential downward trend. Traders often use these crossover signals to enter or exit trades.
Confirming Trend Strength
In addition to identifying trend reversals, MACD can also help traders confirm the strength of a trend. When the MACD line and the signal line are far apart, it suggests a strong trend. Conversely, when they are close together, it indicates a weak trend. By analyzing the distance between these lines, traders can gauge the strength of a trend and adjust their trading strategy accordingly.
Using MACD Histogram
The MACD histogram provides further insight into the strength of a trend. When the histogram bars are above the zero line, it indicates bullish momentum, while bars below the zero line indicate bearish momentum. Additionally, the height of the bars reflects the strength of the momentum. Traders can use the histogram to confirm trend direction and identify potential entry or exit points.
Applying MACD with Other Indicators
While MACD can be effective on its own, combining it with other technical indicators can enhance its reliability. Traders often use MACD in conjunction with other indicators such as moving averages, support and resistance levels, or Fibonacci retracements to validate trade signals. By using multiple indicators, traders can increase their confidence in their trading decisions.
Conclusion
The MACD indicator is a powerful tool that can help traders identify potential trade signals. By understanding how to interpret the MACD line, signal line, and histogram, traders can effectively determine trend direction, strength, and potential entry or exit points. Combining MACD with other indicators can further enhance its accuracy. However, it is important to remember that no indicator is foolproof, and traders should always practice risk management and use additional analysis to make informed trading decisions.

